please support regarding the representation of the support forces
Rstab 8: good assignability of the max/min loads (bold) including associated loads
Rstab 9: clear assignability hardly given (no max/min labeling)
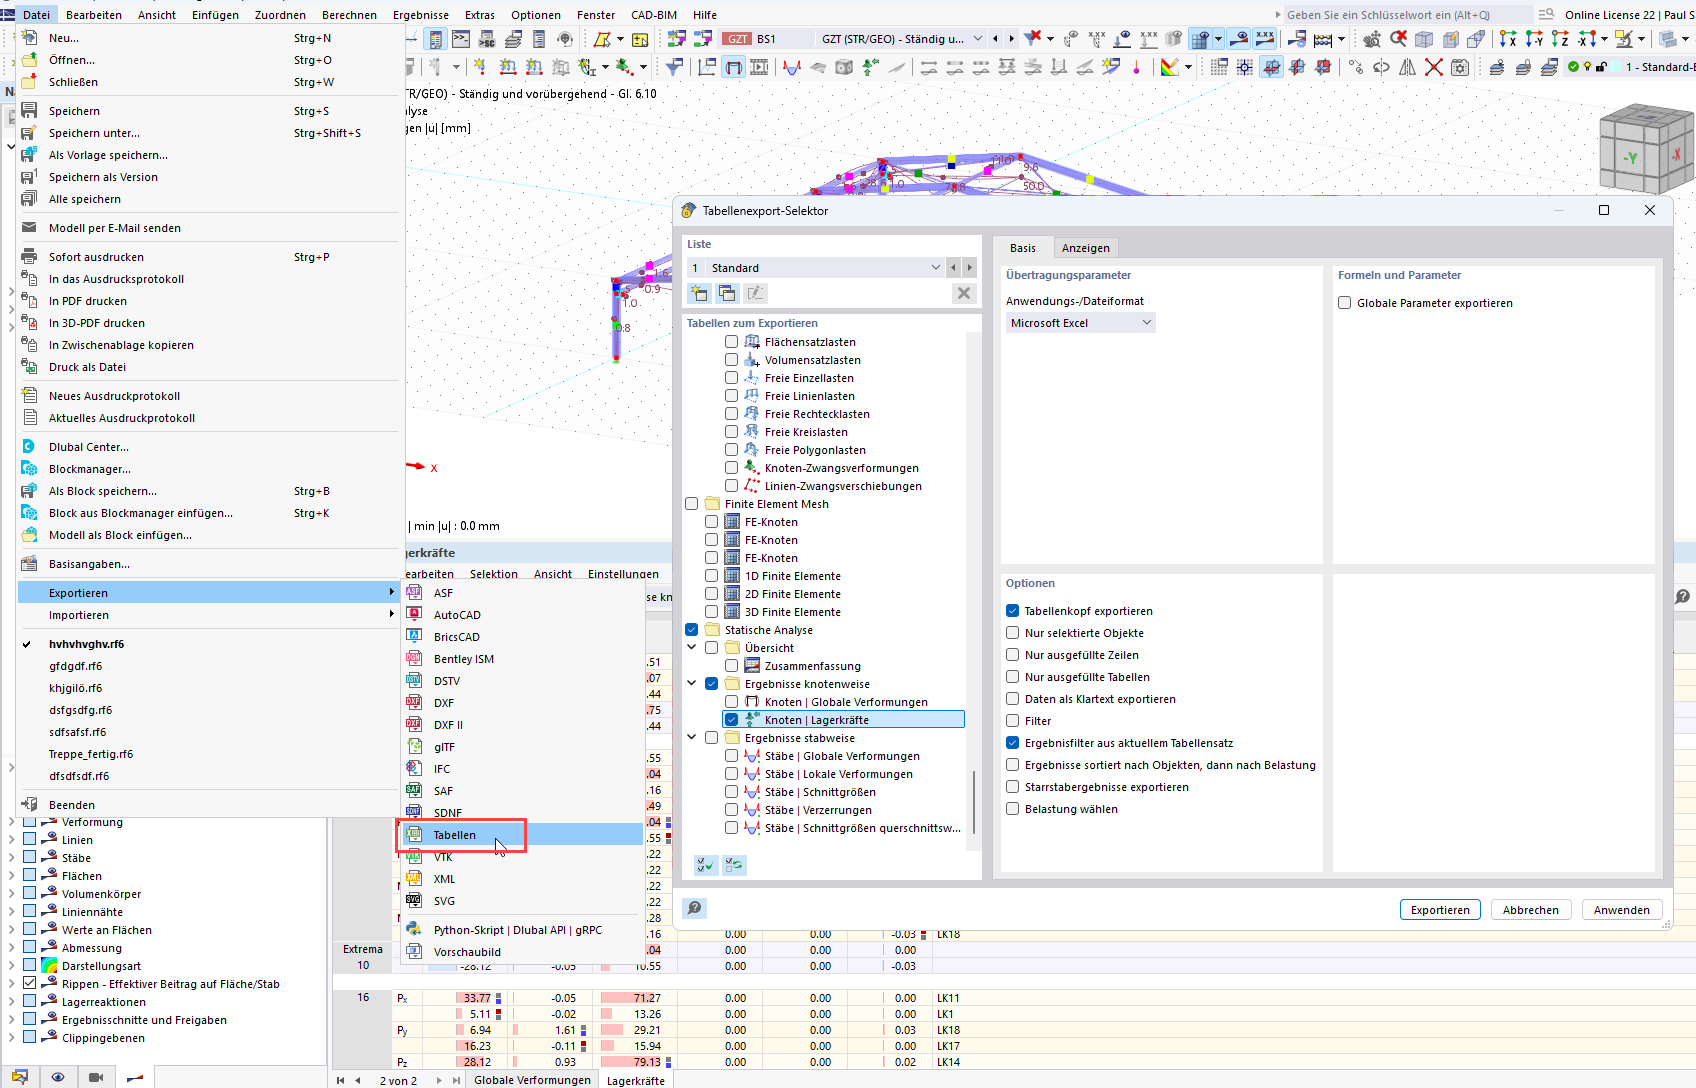
Furthermore: is it possible to export all individual load cases with one click into an xls (possible with Rstab 8 (in lower setting), in Rstab 9 only the current table always)
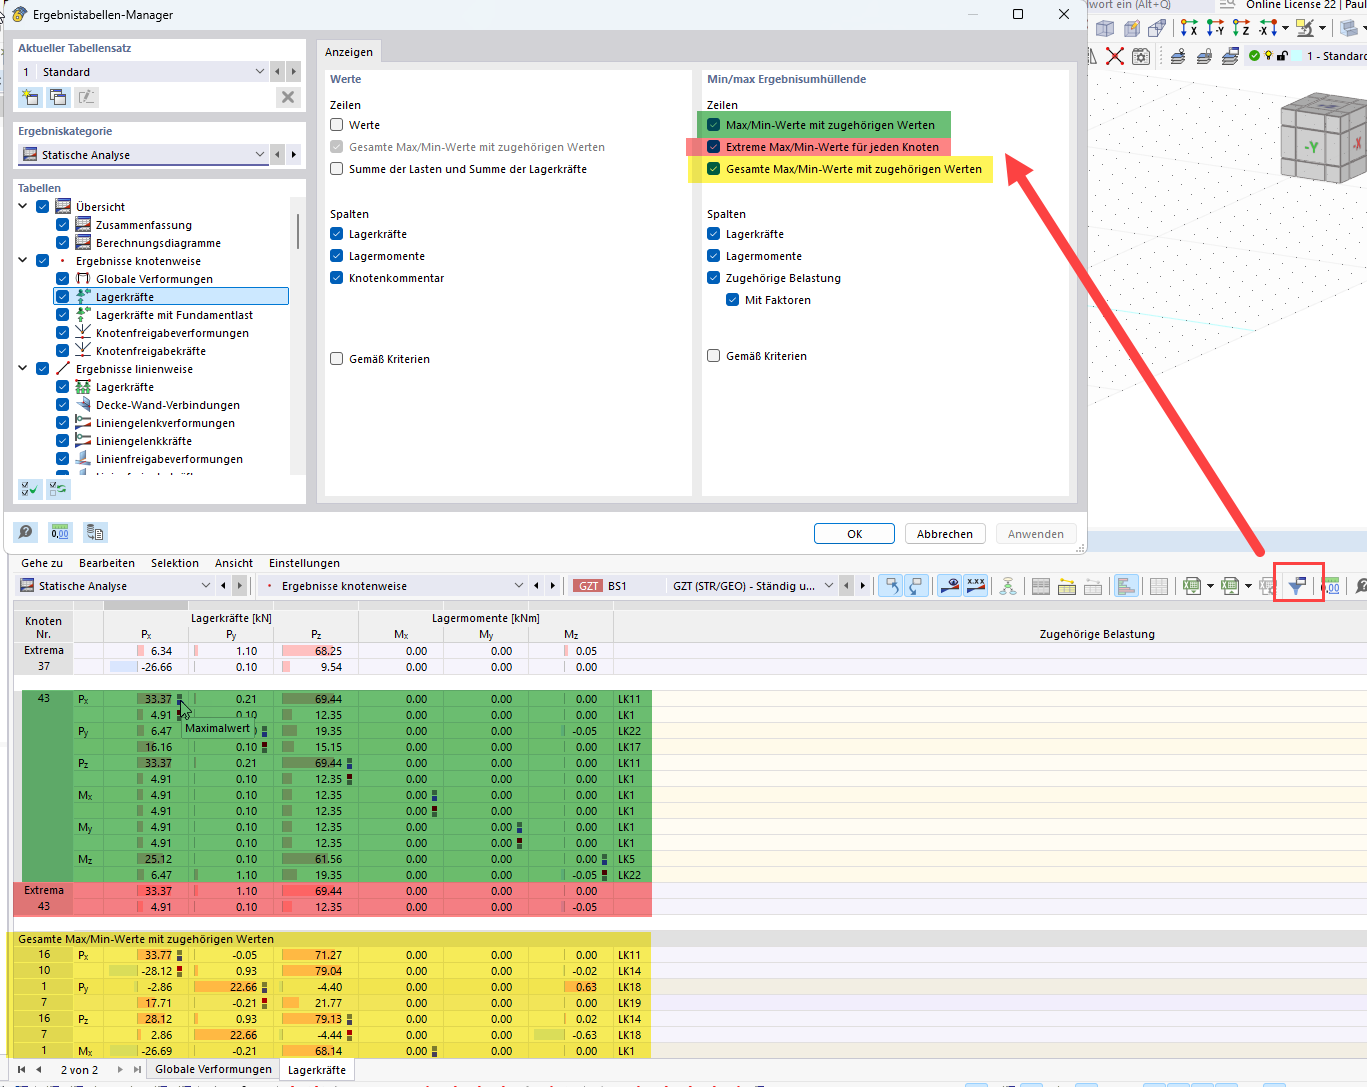
The max/min values are represented by the squares in the table (see the green highlighted table area). The extreme values for each node are displayed separately again (red highlighted table area). Similarly, the global max/min values can be displayed with the corresponding node and load combination (yellow highlighted table area).
Thank you very much for the feedback. Unfortunately, there is repeated feedback that the labeling min and max (i.e., Min Px, Max Px, etc.) is missing in the Excel outputs. This was better solved in RSTAB 8. Can this also be added in RSTAB 9? The squares are already to be selected but are not present in Excel. Thank you very much.