Displaying Results in Sections and Calculation Diagrams

Hello,

I created a solid model in RFEM 6 and would like to evaluate the results. I have two questions about this:

  1. I created sections through the solid and displayed the stresses graphically. How can I display the values at the section graphically? I can’t find the appropriate settings for this. I can display individual values in the solid.

  2. I would also like to create a calculation diagram for selected points. Unfortunately, I can only select nodes located on the lines of the solid. However, I would like to select nodes inside the solid. Is this possible?
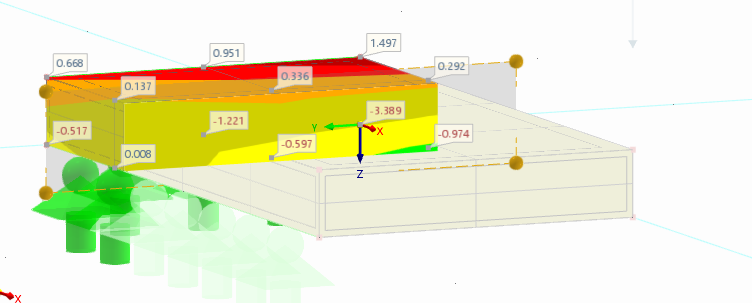
Thank you very much!

Hi emily,

vielen Dank für deine Anfrage.

  1. Mit Clippingebenen kannst du die Elemente innerhalb eines Volumens auch grafisch anzeigen lassen. Siehe bitte dieses Bild und Link.

    https://www.dlubal.com/de/downloads-und-infos/dokumente/online-handbuecher/rfem-6/000216#mainTab
  2. Nein das ist so nicht möglich. Wenn du einen konkreten Punkt weißt, könntest du ihn als realen Knoten erstellen und in das Volumen integrieren. Hierfür dann in den Netzeinstellungen auch die nicht verwendeten Objekte integrieren.
    https://www.dlubal.com/de/downloads-und-infos/dokumente/online-handbuecher/rfem-6/000242#surfacesTab
    Viele Grüße
    Bastian Kuhn