Derive 'Total' rows from get_results() data

Hello,

I would appreciate help with analyzing data retrieved by the get_results() function.

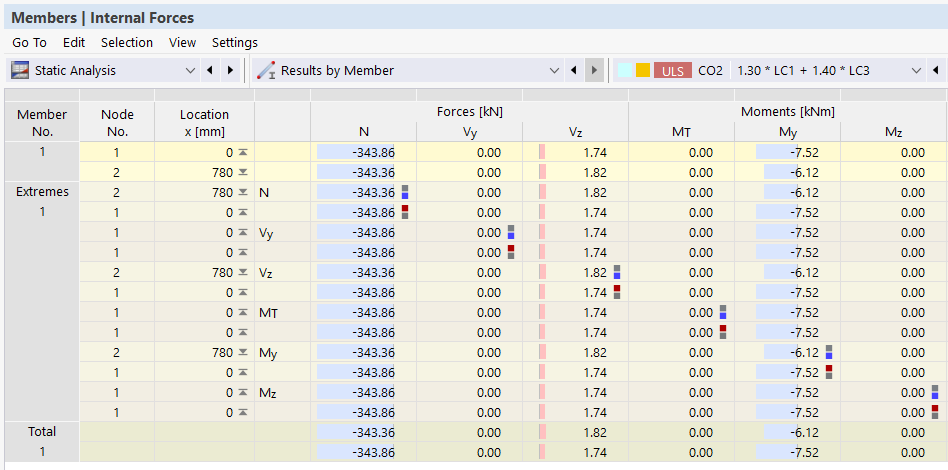
In the old API, I was able to get rows named 'Total' for each member in Internal Forces table of all load combinations. Now I use function get_results() in the new GRPC API where the number of rows is different than the number of rows shown in the GUI. How can I derive the 'Totals' from these limited sets of rows?

I am primarily a programmer, so I may be missing something fundamental from static analysis. Please could you share how it is computed? What is the logic behind it?

Here are some examples:
Results - member 1 for load combination CO2 (only 7 rows vs 16 in GUI):

row_number loading increment member_no node_no location_x tag n v_y v_z m_t m_y m_z
18124 CO2 1 1 0.0 -343858.0 0.0 1744.3349609375 0.0 -7515.85888671875 0.0
18125 CO2 1 0.156 -343758.1875 0.0 1761.5660400390625 0.0 -7241.98291015625 0.0
18126 CO2 1 0.312 -343658.5 0.0 1777.5830078125 0.0 -6965.64990234375 0.0
18127 CO2 1 0.39 -343608.59375 0.0 1785.134033203125 0.0 -6826.5908203125 0.0
18128 CO2 1 0.4679 -343558.6875 0.0 1792.376953125 0.0 -6686.9541015625 0.0
18129 CO2 1 0.624 -343459.0 0.0 1805.93798828125 0.0 -6405.9931640625 0.0
18130 CO2 1 2 0.78 -343359.1875 0.0 1818.259033203125 0.0 -6122.86181640625 0.0

RFEM6 version: 6.14.0005

Thank you in advance.
Jane

Hi Jane,

The row-count mismatch is because get_results() and get_result_table() return two different things:

  • get_results() returns the raw values at each output/division location along the member — no aggregation, no "Total" row. That's why you only get 7 rows for member 1 in CO2.

  • get_result_table() returns the preprocessed table exactly as shown in the GUI's Internal Forces table, including the governing extreme rows (n_max/n_min, v_y_max/v_y_min, ... and finally total_max/total_min). This is the direct equivalent of the old API's "Total" rows.

So for your case, use get_result_table instead:

from dlubal.api import rfem

with rfem.Application() as rfem_app:
    table = rfem_app.get_result_table(
        table=rfem.results.STATIC_ANALYSIS_MEMBERS_INTERNAL_FORCES_TABLE,
        loading=rfem.ObjectId(no=2, object_type=rfem.OBJECT_TYPE_LOAD_COMBINATION),  # no=2 -> CO2
    ).data

# filter to just member 1
member_1 = table[table["member_no"] == 1]

# the two rows equivalent to the old API's "Total" row:
totals = table[table["tag"].isin(["total_max", "total_min"])]
print(totals)

Notes:

  • loading takes an ObjectId (the load case/combination number, not its name) — use object_type=rfem.OBJECT_TYPE_LOAD_COMBINATION for a combination or OBJECT_TYPE_LOAD_CASE for a load case.

  • get_result_table() isn't filtered by member — it returns the whole model's table for that loading, so filter the resulting DataFrame by member_no afterwards.

  • If you specifically need the extremes computed from get_results() instead (e.g. for a custom aggregation), you'd need to group/aggregate the raw rows yourself — get_result_table() is the one that mirrors the GUI's "Total" row logic directly.

Regards

Hi,
thank you for your detailed response. I need to process many load combinations at once, so using get_results() function is better option in my case.

But I need to know, how exactly are the 'total_max' and 'total_min' values computed by get_result_table() function. Does this mean that I should find min/max value from the raw values of division locations? Are all columns taken into account or is the min/max value computed only from one column (maybe forces 'N' column)?
How can I be sure that it matches the GUI logic perfectly?

Thank you.
Jane

Hi Jane,

Thanks for the screenshot — that pins down the question nicely. The short answer is that the Total row is simpler than it looks, and understanding it explains the row-count difference.

The Total row is a column-wise extreme, and nothing more.

For each column separately, RFEM takes the max (and min) over all output locations. The columns are computed independently of one another. The Total row is not a point in the model, and its values generally do not occur together.

Your own screenshot shows this well. In the Total max row:

value comes from
m_x = 4.76 FE node 602
m_y = 9.63 FE node 600
v_y = 70.45 FE node 17
n_y = 428.17 FE node 16

Four different nodes in one row. That's also why the Total row has no node number and no coordinates — there is no single location it belongs to.

So you can reproduce it from get_results() directly, because it is just a per-column min/max over the raw rows:

df = rfem_app.get_results(...).data
cols = ["n", "v_y", "v_z", "m_t", "m_y", "m_z"]   # surfaces: m_x, m_y, m_xy, v_x, v_y, n_x, n_y, n_xy
total_max = df[cols].max()
total_min = df[cols].min()

That will match the GUI's Total row exactly.

If you need values that belong together, use the block above it.

The rows above Total — "Total max/min values with corresponding values" in your screenshot — are the ones that preserve the coupling. Each is a real location: the extreme of one quantity, together with the corresponding values of every other quantity at that same point. That's what you want for questions like "what is m_y where m_x is maximal", or on members "what is M_y at max N".

A member example makes the difference concrete:

tag        location_x     v_z [kN]    m_y [kNm]
v_z_max        0.000         74.86       -89.18     <- real point
m_y_max        3.600          2.86        50.73     <- real point
total_max        --           74.86        50.73     <- x=0.000 and x=3.600 mixed, no location

total_max reports 74.86 and 50.73 side by side, but they occur 3.6 m apart.

Both blocks come back from get_result_table() with a tag column (n_max, v_z_max, m_y_max, … and finally total_max / total_min), so you can pick whichever you need without aggregating yourself. If you'd rather stay with get_results(), the snippet above gives you the Total row, but the "with corresponding values" rows you'd have to build yourself by locating the extreme's index and taking that whole row — e.g. df.loc[df["m_y"].idxmax()].

Regards

Hello,

thank you for the detailed explanation, much appreciated! This resolved my confusion and now I better understand the values. I’ll implement the per-column max/min for Totals rows.

Jane