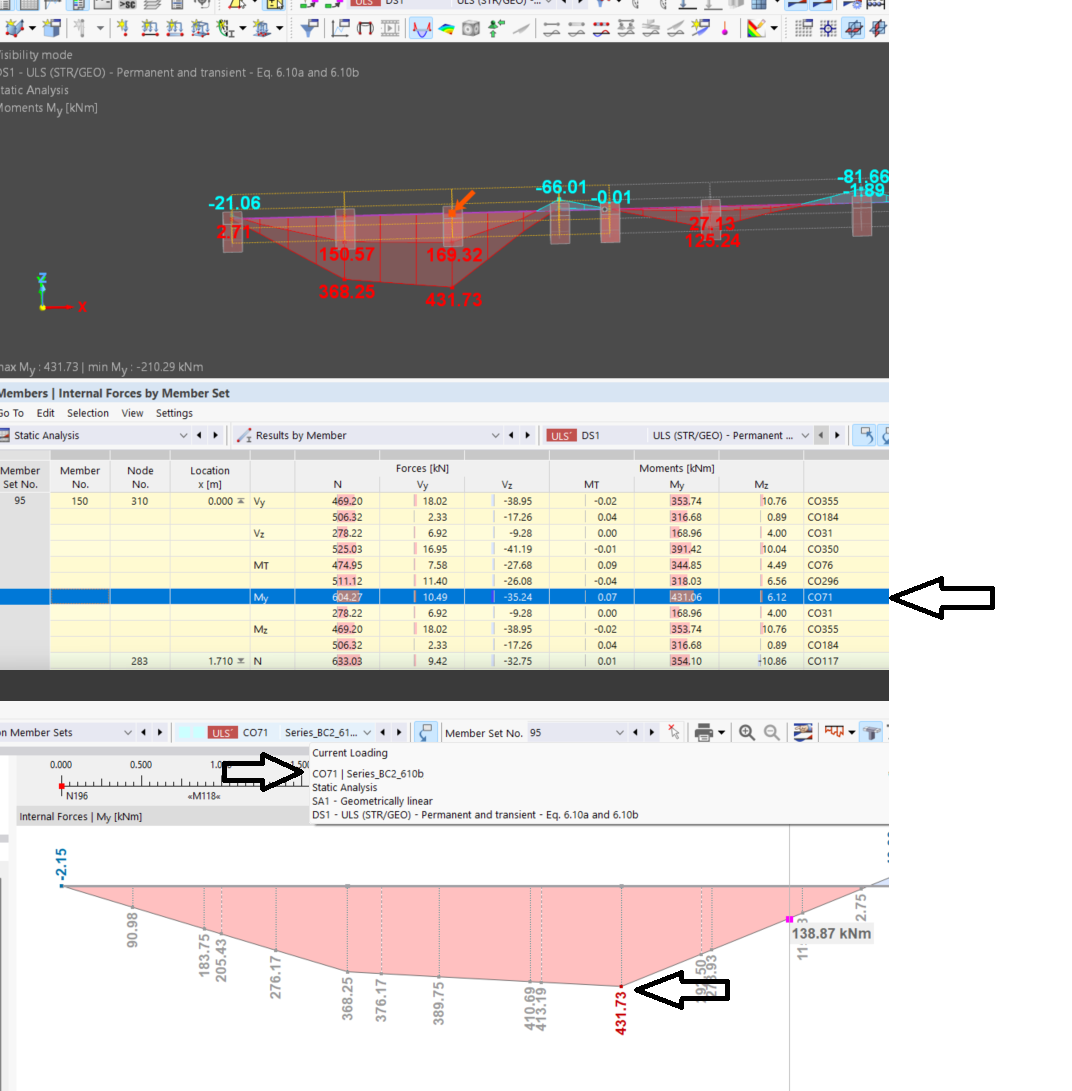
Situation: In RFEM6.12.0007, the 3D view window shows that the maximum bending moment in the beam is 431.73 kNm.
My need: I would like to know in which load combination does this maximum bending moment happen. So I check the table values.
Problem: The table value shows a smaller maximum value in the beam, as 431.06 kNm fpr CO71. So I double-check this in the second table 'results diagram dialog'. There it shows correctly that in CO71, the maximum bending moment is 431.73 kNm. But to make sure, I had to force-scroll through tens of combinations to find the value of 431.73 kNm.
Question: why does the bottom-of-the-page tables show a wrong value?
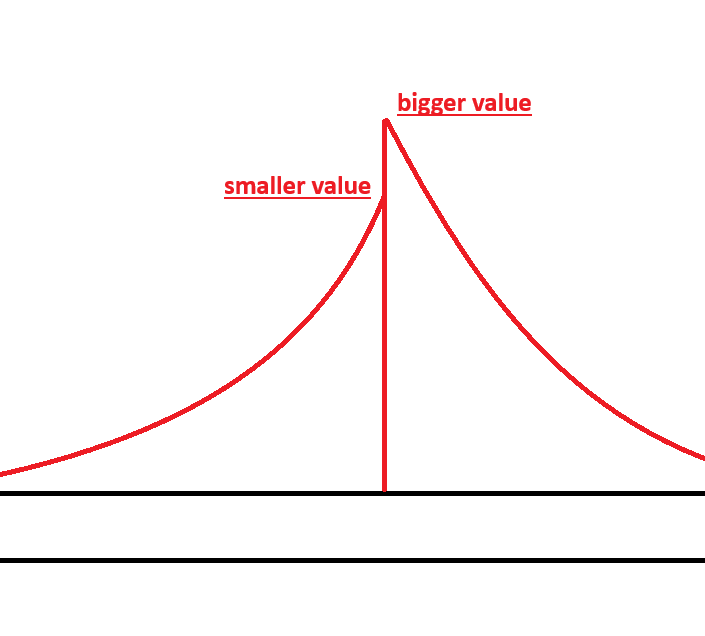
It turned our that in the 3D view, at the peak location, there was a step in the diagram, and the label for the bigger value obscured the smaller value. I needed to zoom in by a lot to reveal the obscured smaller value.