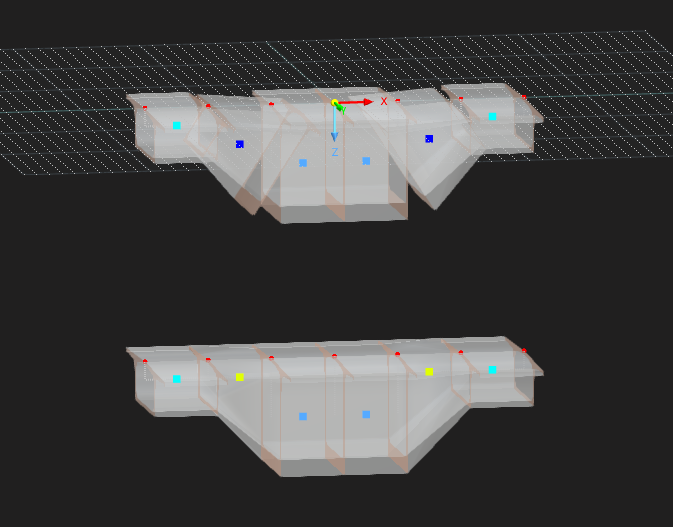
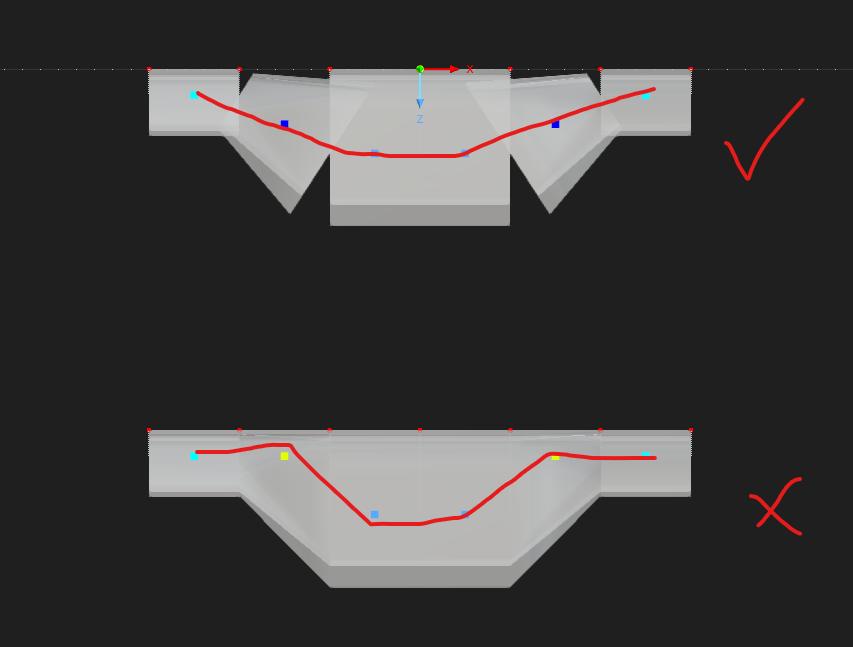
I'm trying to model a linear variable section in RFEM. When I use the eccentricity option "TOP", the model appears as shown in top model . However, the graphical display doesn't look correct, although the blue dots indicating the center of gravity seem accurate.
When I use an "absolute offset" and apply the calculated centroid, the graphical representation looks correct, but the yellow dots don't appear to be in the right position.
Can you please send me the file for your problem. That will make it easier for me to understand.
You can attach the file directly in a reply to this thread. Alternatively, you can also send me a private message. Click on my name and then click on “Message”.
I did a little research to find out why the upload didn't work. The reason is the different trust levels that are built into our forum software (Discourse). Uploading files is only possible from a certain trust level. To reach this level, the user must have carried out a certain number of interactions, e.g. read a certain number of articles. You have apparently not yet reached this threshold.
Many thanks for the file. Now the problem is clearer to me.
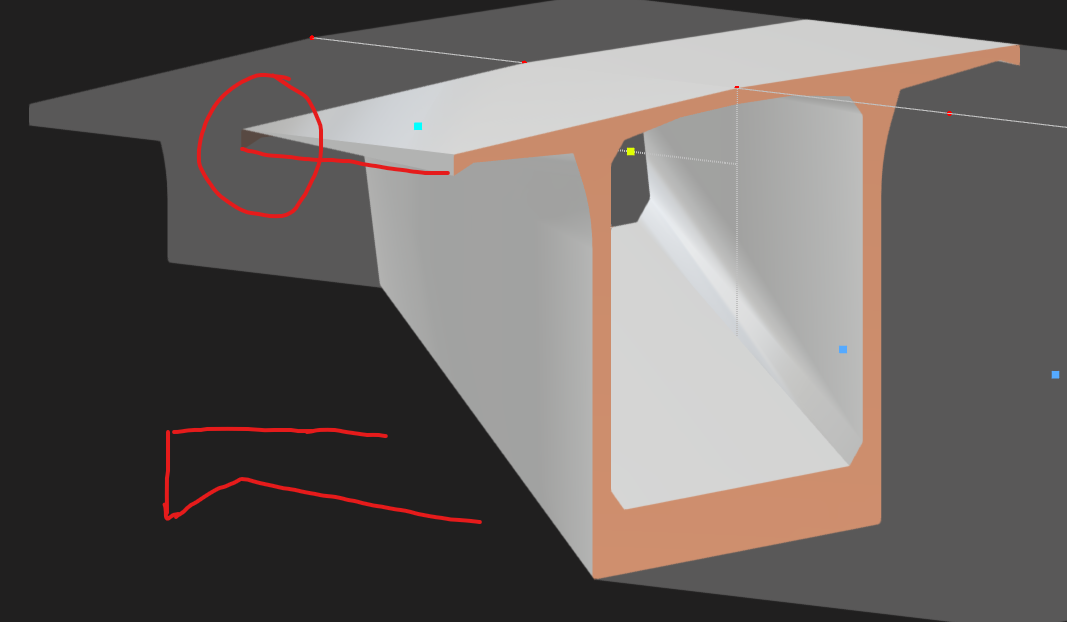
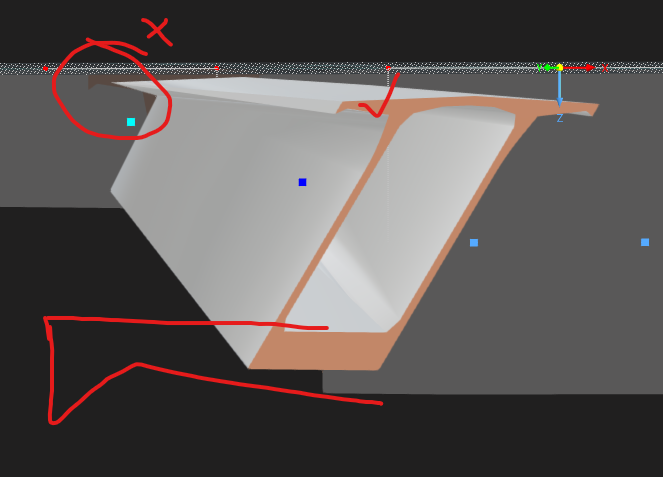
I would not overestimate the not quite correct graphical representation in the graphic above. Ultimately, the graphical display in RFEM is not about millimeter precision. The aim of the cross-section display is to avoid rough input errors
In your example, the eccentricity is in the same order of magnitude as the member length. I assume you did this to emphasize the problem. If the eccentricities are small compared to the member length, then there will hardly be any differences in the internal forces between the two models. If this is the case, then both models represent reality accurately enough.
These are errors in the graphics. These have no effect on the calculation.
For the solver, members are nothing more than lines with a stiffness. The stiffness is transmitted to the solver by I, A, E... . The solver does not "know" anything about the specific shape of the cross-section.