Good day,
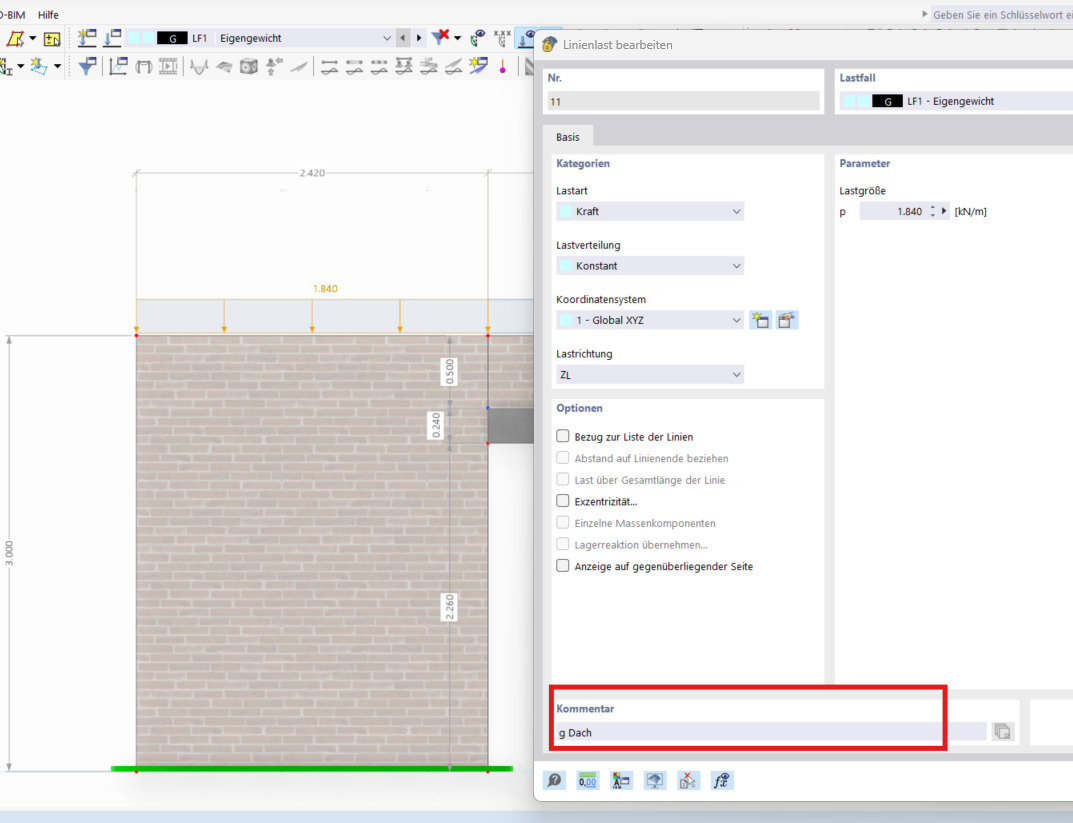
Is there a way to graphically display comments for line loads?
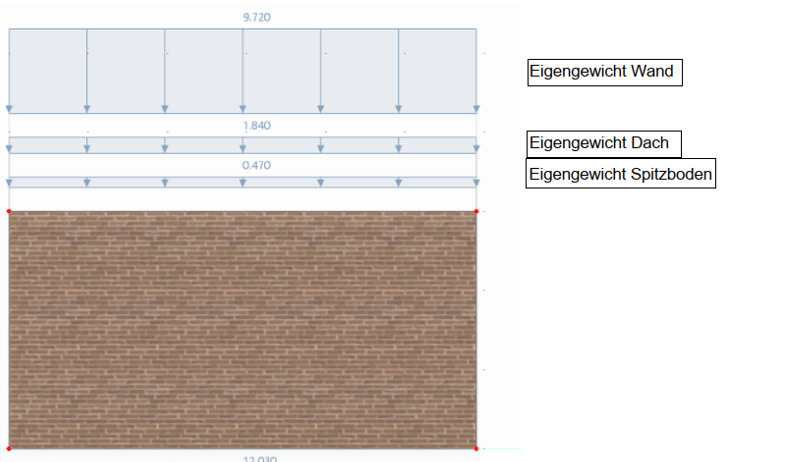
As part of a project for my university, I am creating a positional static analysis where I want to present all inputs in a particularly transparent and comprehensible manner. It would be great if multiple loads in the same load case could be graphically read, showing from which components they are composed.
I imagine it to be something similar to the following image:
Best regards,
Nick Böttcher
