I am working with the RFEM API in Visual Studio Code and am trying to retrieve the different stress components. I would like to retrieve σx+, but this does not appear to be available as a separate option. Therefore, I am using the basic stress results at the bottom, middle and top of the surface.
I noticed that the values in the generated tables differ depending on the orientation of the local coordinate system defined in the base data. When the z-axis is oriented downward, the results correspond correctly to the values shown in RFEM. However, when the z-axis is oriented upward, the values generated by the API do not correspond to the results displayed in RFEM.
I have prepared a file containing several comparisons.
In conclusion, my question is: Is there an issue with the API when generating these tables, or am I interpreting the results incorrectly?
Yes, I compared the same values. It looks like the table from the API flips the bottom and top rows or something like that. Or i totally misunderstand something.
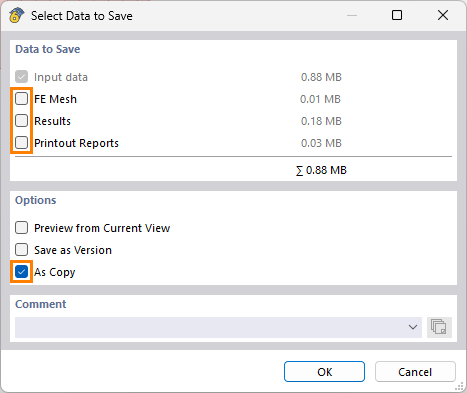
 Click on File → Save as and choose the following settings to reduce the file size:
 Prefer not to share the file publicly? No problem – send it to me via direct message: click on my profile picture or user name → Message.