Good day again,
after I have now become reasonably familiar with input and output as well as evaluation of results using the API, I am now facing the challenge of correctly evaluating the maximum comparative strains.
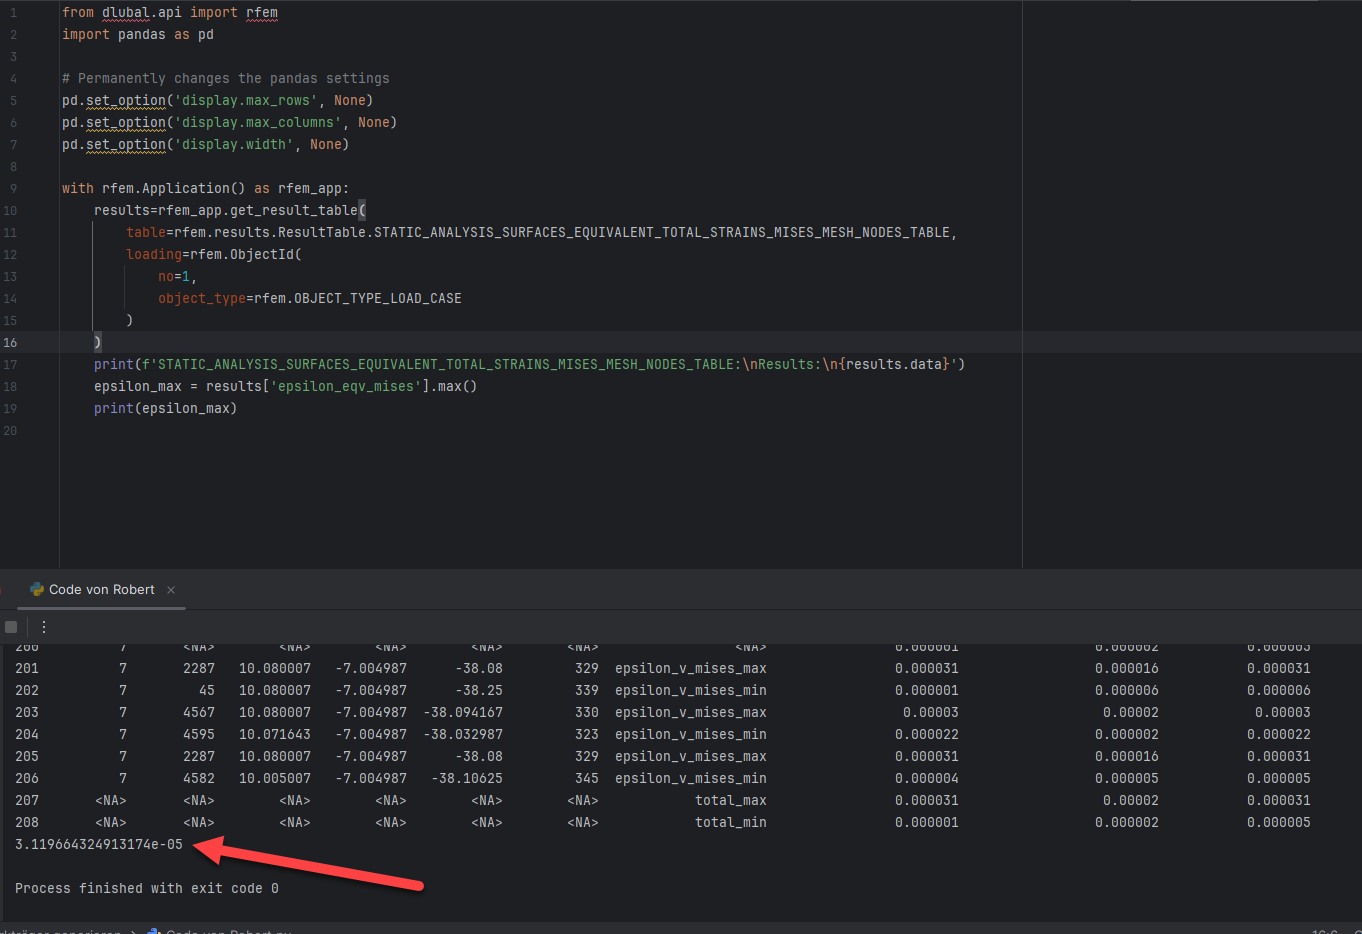
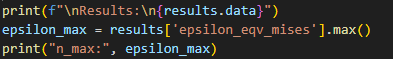
For this, I use the following CODE:
The result of the code is:
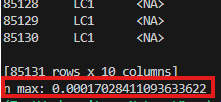
From my point of view, the expected value would be:
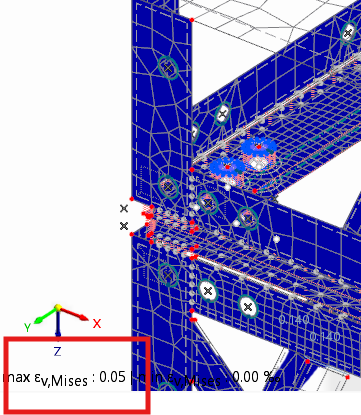
This results from graphically evaluating the comparative strain via the GUI.
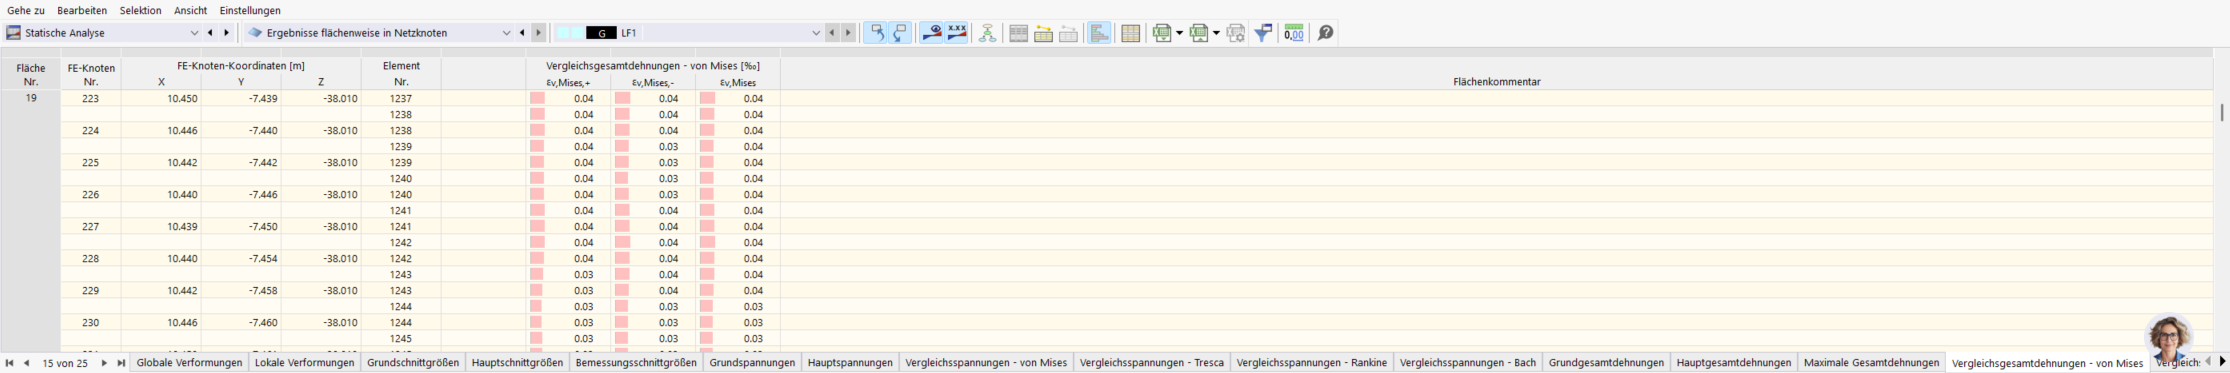
On closer examination of the table, I find the following:
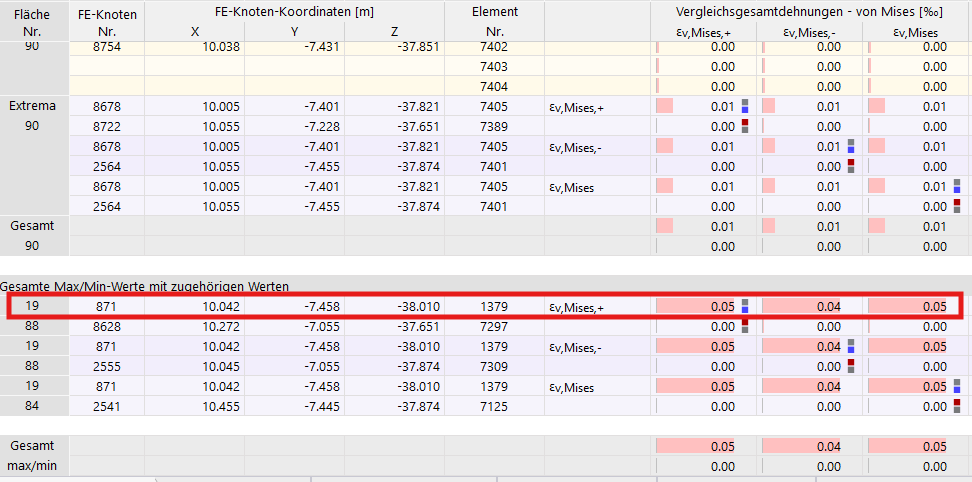
The 0.05 per mille comparative strain occurs at area number 19 in FE node 871.
Consequently, the value belonging to area 19 should be found in the table,
however, no values are listed in the table for area 19:
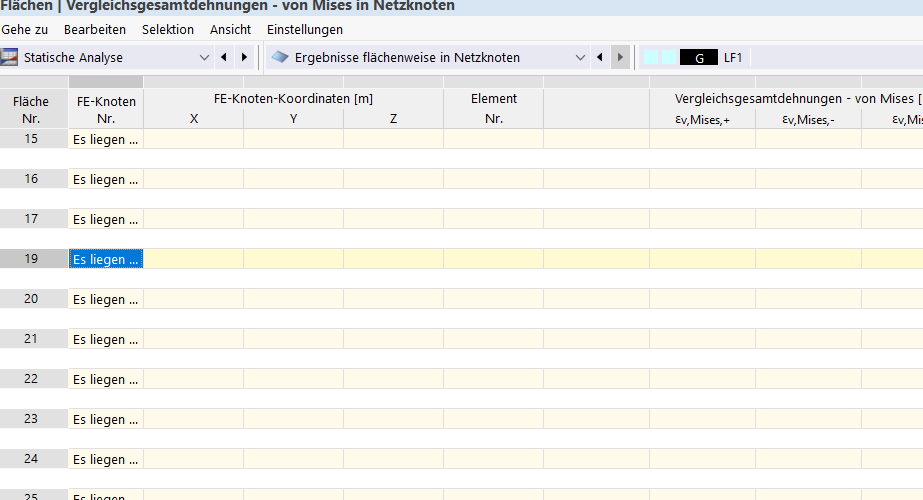
Here it says: "There are no grid points in the area."
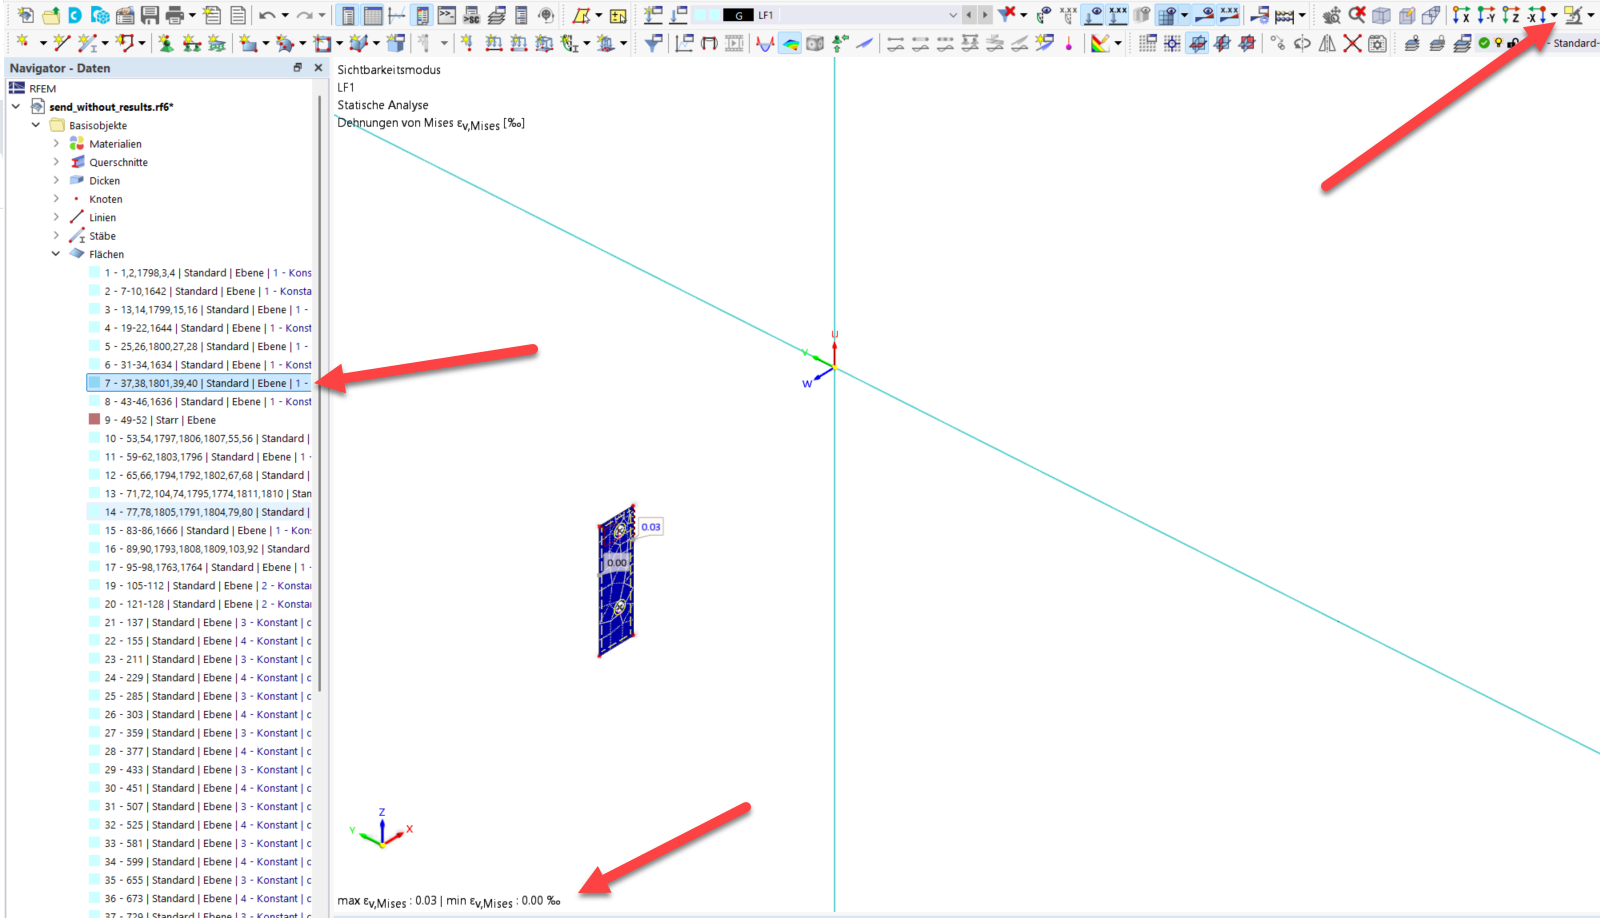
Where does this come from? And how do I solve it? Graphically, I can obviously display the values of area 19
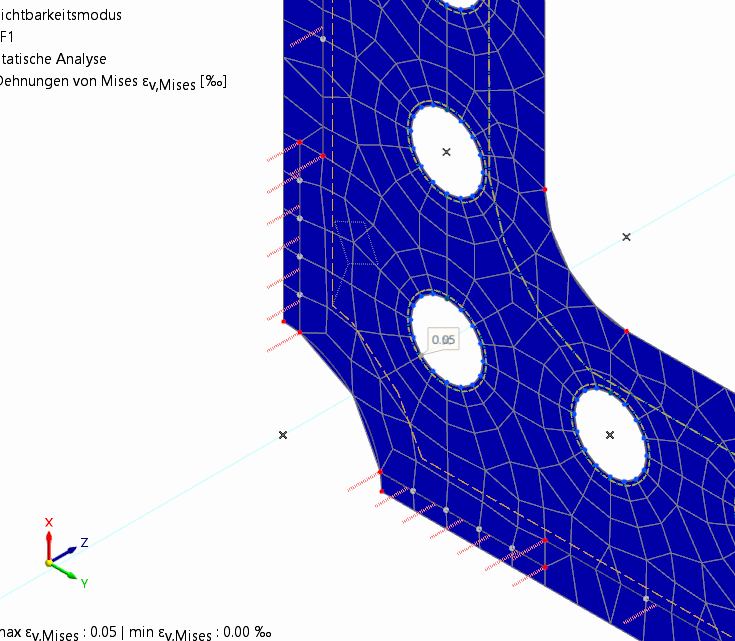
In the previous image, the mesh nodes and elements as well as the strains of 0.05 of the front plate are graphically shown, which I would like to have in table form or, much more importantly, retrievable via the API2 (in principle, it has already been proven with other models that the table values can be reliably evaluated with my code, provided they are completely available).
I would be very pleased to receive feedback,
Best regards,
Nick Böttcher