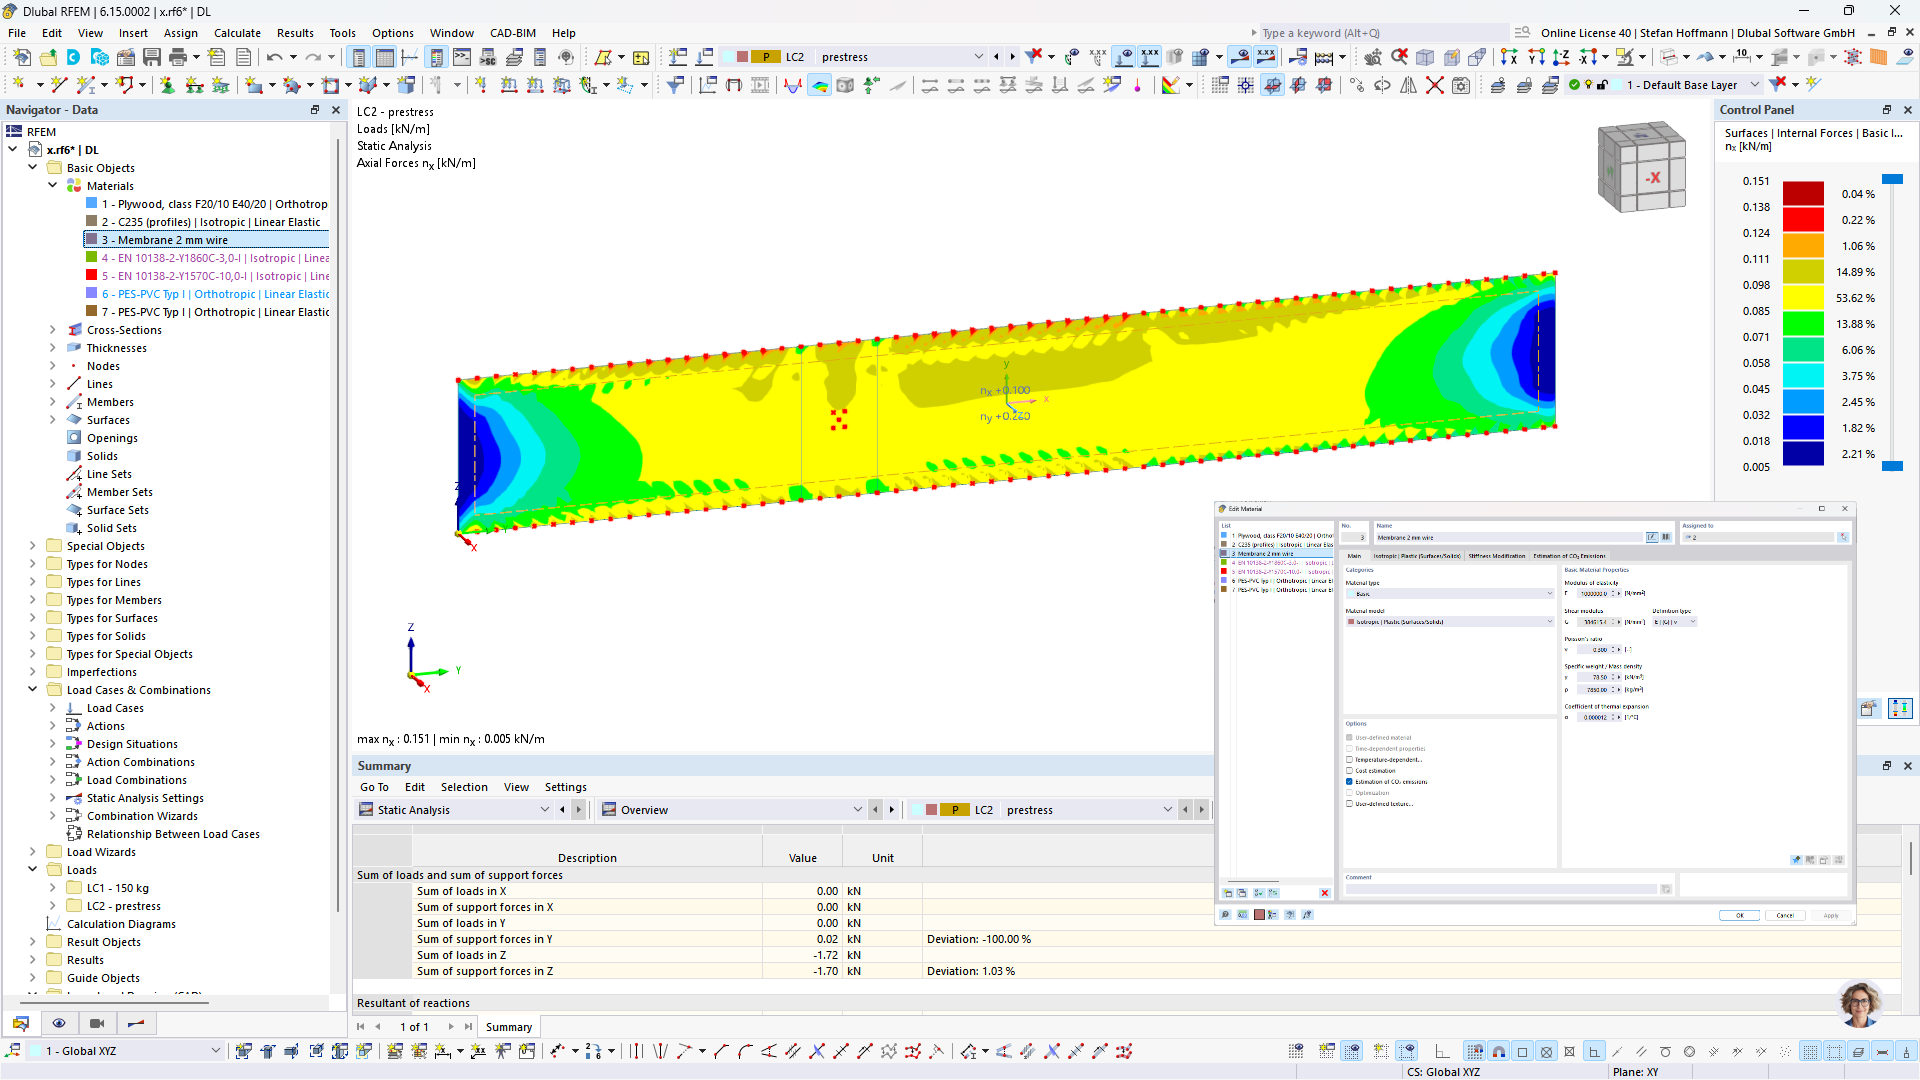
Экран госпиталя.rf6 (1,6 МБ)
Good afternoon! I am writing a research paper on the topic “Deformability and Shape Optimization in Lattice Structures.” I am trying to model a lattice made of thin steel cables as a membrane with a nonlinear material.
The problem is that when I define the surface using the “membrane” element with a nonlinear material and a user-defined material work diagram, the calculation does not run at all. It returns error 1327.
If I use a standard thickness instead of a membrane, the calculation runs, but I cannot use the shapefinding function when using a nonlinear material with a user-defined material diagram. Error 10121 occurs: “The Jacobian matrix is not positive definite.”
This may be due to the surface thickness being too small or the initial stiffness being very low?
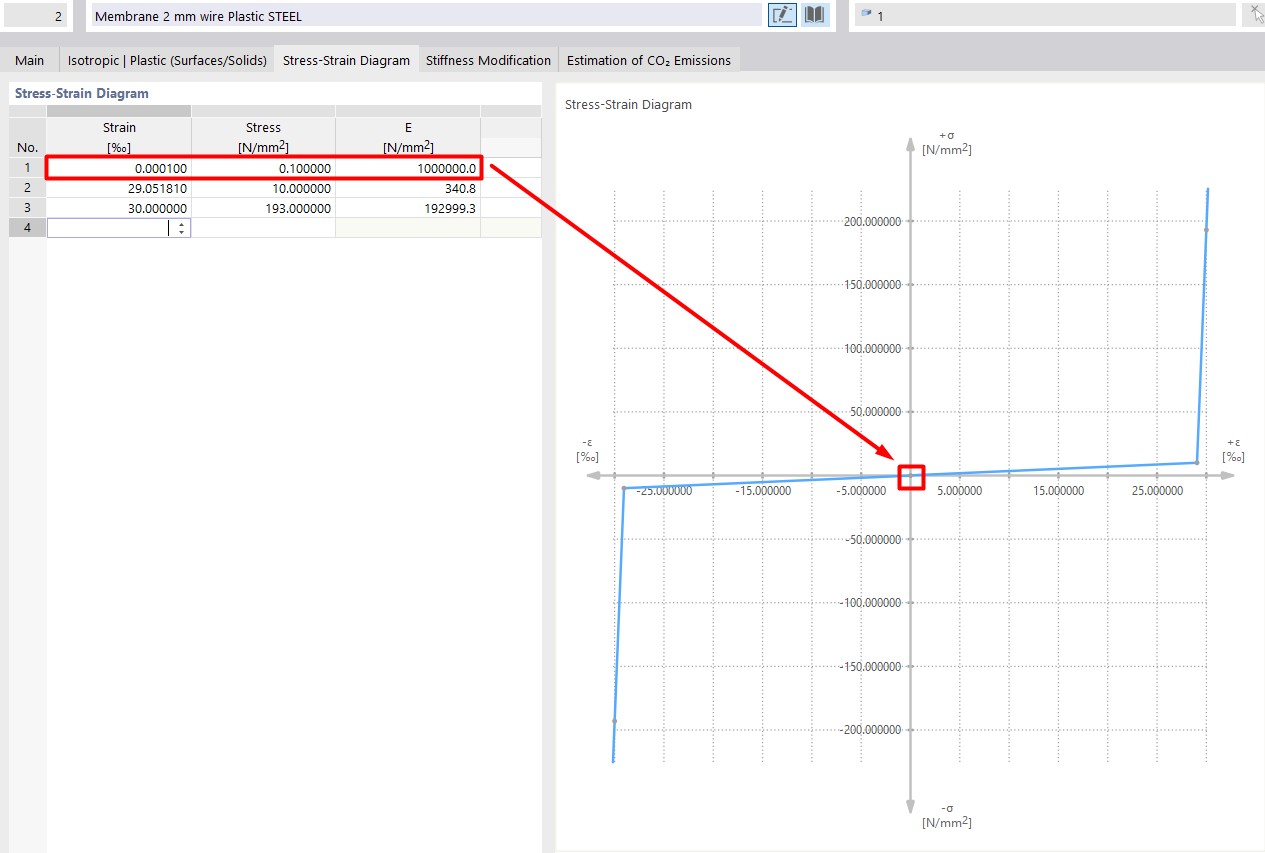
Thanks for the advice. The calculation is indeed performed in the plastic type. I have one more quick question. Is the full stress strain taken into account in the iterative calculation according my diagram? I had to resort to a bit of a workaround in the initial range to meet the program's requirements.
As I understand it, the program's default setting uses a decreasing sigma/epsilon curve, such as that for concrete. In my case, however, the stiffness does not decrease as the load increases; rather, it increases.
Hi Stefan! My design operates only in the tensile zone. There is no compression. My question is that the program’s default settings don’t recognize a graph with increasing stiffness. They only recognize one with decreasing stiffness, so I had to create a section with very high tangential stiffness right at the beginning. That’s why I’m wondering if the program is interpreting my graph correctly. After all, I kind of “tricked” the program a little.
Thank you for your support.
I have one more question about the RFEM 6 functionality. Is it possible to obtain the system's strain energy density in tabular form?